React Error Monitoring with Honeycomb

Imagine your React application running smoothly in production. You’ve meticulously tested every feature, checked for bugs, and ensured a seamless user experience. But let’s face it: no matter how much you prepare, unforeseen errors can creep in. 😰
Now picture this: an end-user stumbles upon a cryptic error page. Frustrated, they reach out to your support team, offering only a vague description of the problem—no screenshots, no context. Diagnosing the issue becomes a daunting, time-consuming task. Worst case? The user doesn’t even report the error. You remain blissfully unaware of a problem quietly frustrating your users. That’s a recipe for disaster.
But there’s good news: you don’t have to live in the dark.
Why Robust Error Logging is Your Best Friend
Errors don’t have to be a guessing game. With the right tools, you can turn those headaches into insights. A powerful logging system is your secret weapon. Here's how it works:
- 🕵️ Detect Issues Before Users Report Them: Gain instant visibility into errors—no more waiting for vague user feedback.
- 🛠️ Pinpoint the Root Cause in Seconds: Logs provide precise information, including the exact location of the error and the context in which it occurred.
- ⚡ Slash Debugging Time: What used to take hours can now be resolved in minutes.
- 📊 Proactively Improve Your App: Analyze trends, uncover hidden bugs, and fortify your app’s stability.
What is Honeycomb?
Honeycomb is a powerful observability tool that helps you track and debug errors in your applications. While tools like Sentry and LogRocket are well-known, they can sometimes be pricey or overly complex. Honeycomb stands out for being cost-effective, developer-friendly, and easy to integrate with tools like React.
With Honeycomb, you get the perfect mix of powerful insights and affordability, making it an excellent choice for developers who want to monitor and improve their applications without hassle.
Why Choose Honeycomb for Your React App?
When it comes to logging, Honeycomb stands out as a game-changer. Whether you’re a solo developer or part of a large team, Honeycomb offers a cost-effective, flexible, and easy-to-use solution to tackle errors like a pro. Here’s why it’s a perfect fit:
- Real-Time Insights: Get notified of issues as they happen—no more surprises.
- Custom Alerts: Stay informed with tailored notifications for the errors that matter most.
- Actionable Data: Dive deep into logs to understand not just the “what” but the “why” behind every error.
What You’ll Learn in This Guide
Ready to transform how you handle errors? In this blog, we’ll walk you through integrating Honeycomb with your React application. By the end, you’ll have a robust logging system up and running, complete with real-time alerts. Here's the roadmap:
Initializing Honeycomb
- Learn how to set up Honeycomb and project configuration. We’ll explore how to obtain the necessary API keys for your Honeycomb environment to capture logs.
- Learn how to set up Honeycomb and project configuration. We’ll explore how to obtain the necessary API keys for your Honeycomb environment to capture logs.
Integrating Honeycomb with React
- Discover how to seamlessly plug Honeycomb into your React app. We’ll cover installation, configuration, and sending logs effortlessly.
- Discover how to seamlessly plug Honeycomb into your React app. We’ll cover installation, configuration, and sending logs effortlessly.
Configuring Alerts
- Setting up real-time alerts in Honeycomb is key to staying on top of errors. You’ll learn how to define specific conditions that trigger alerts, so you’re notified when critical issues arise. Plus, we’ll show you how to customize notification channels like email, ensuring you get timely, actionable updates that help you resolve problems fast and keep your app running smoothly.
- Setting up real-time alerts in Honeycomb is key to staying on top of errors. You’ll learn how to define specific conditions that trigger alerts, so you’re notified when critical issues arise. Plus, we’ll show you how to customize notification channels like email, ensuring you get timely, actionable updates that help you resolve problems fast and keep your app running smoothly.
Why Wait? Build a Resilient React App Today
By investing a little time in setting up Honeycomb, you’re not just tracking errors—you’re gaining peace of mind. You’ll proactively address issues, delight users with a smoother experience, and ensure your app shines even in the face of unexpected challenges.
Ready to dive in? Let’s make your React application error-proof, one log at a time!
Step 1: Initializing Honeycomb
To get started with Honeycomb, you need to set up your environment and obtain the necessary credentials for logging. Follow these steps to initialize Honeycomb for your React application:
1.1 Sign Up or Log In to Honeycomb
- Visit Honeycomb.io to sign up for a free account if you’re a new user.
- If you’re an existing user, log in to access your Honeycomb dashboard.
1.2 Setting Up Your Honeycomb Environment
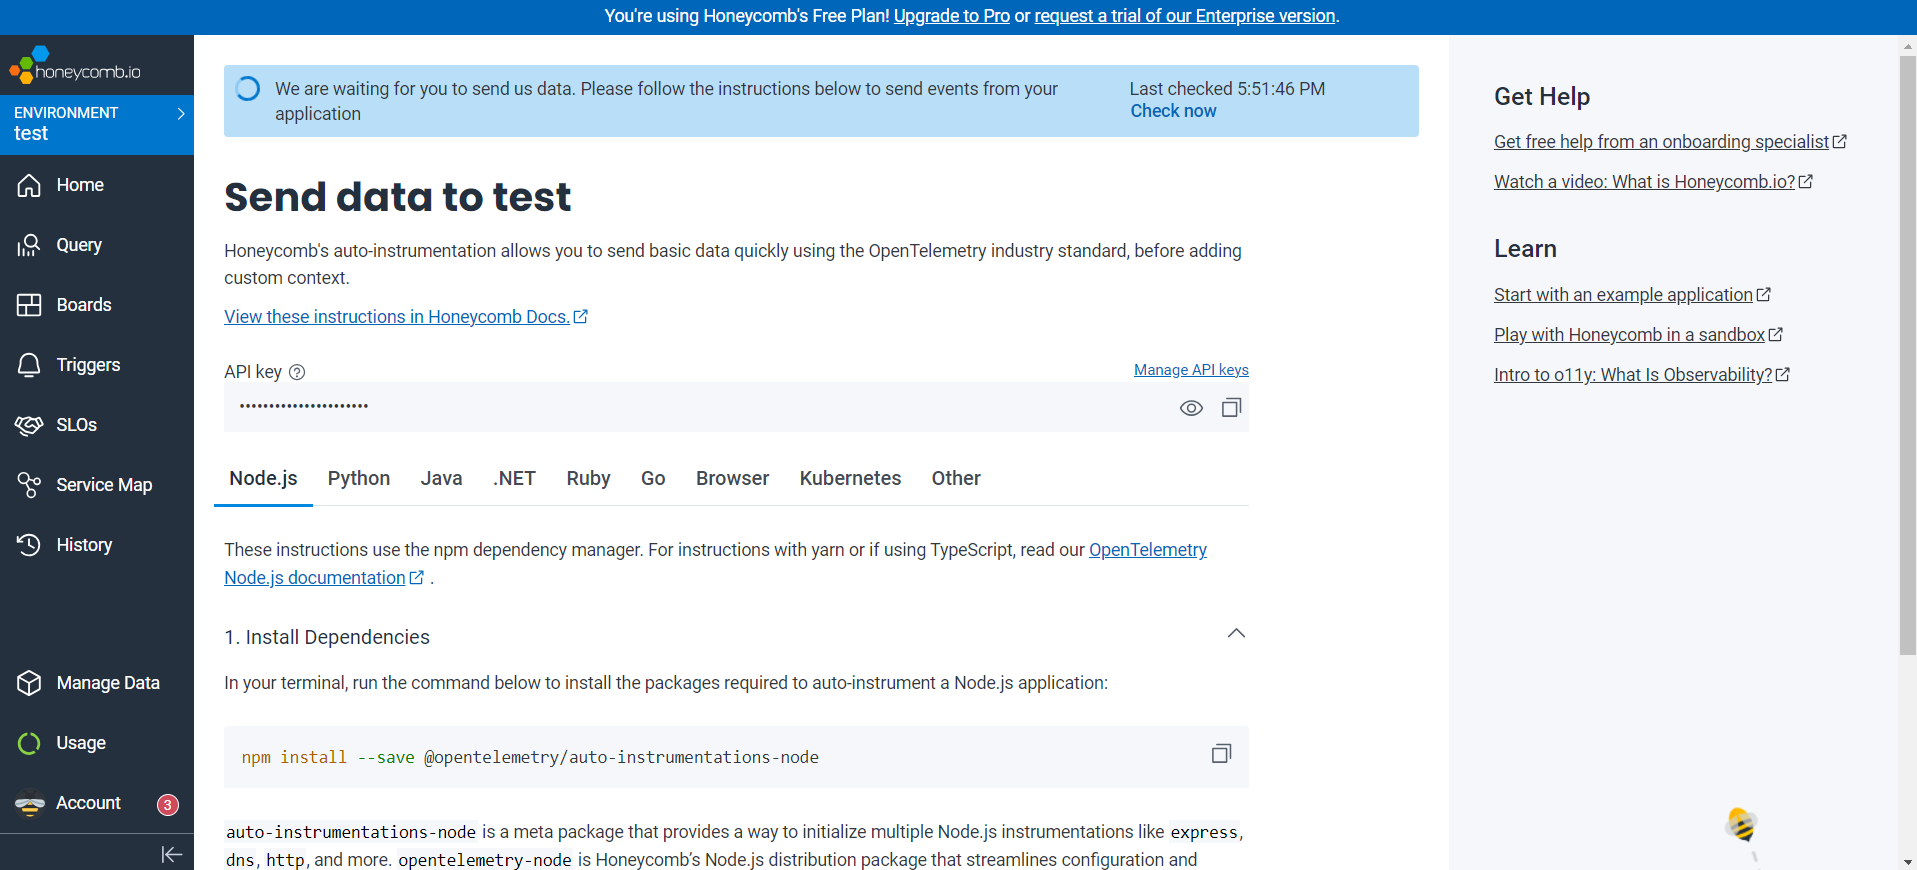
- After signing up and setting up your team, Honeycomb automatically creates a test environment (essentially a project) for you. You’ll be redirected to a setup page where you can see your API Key - copy it for later use.
If you already have an account:
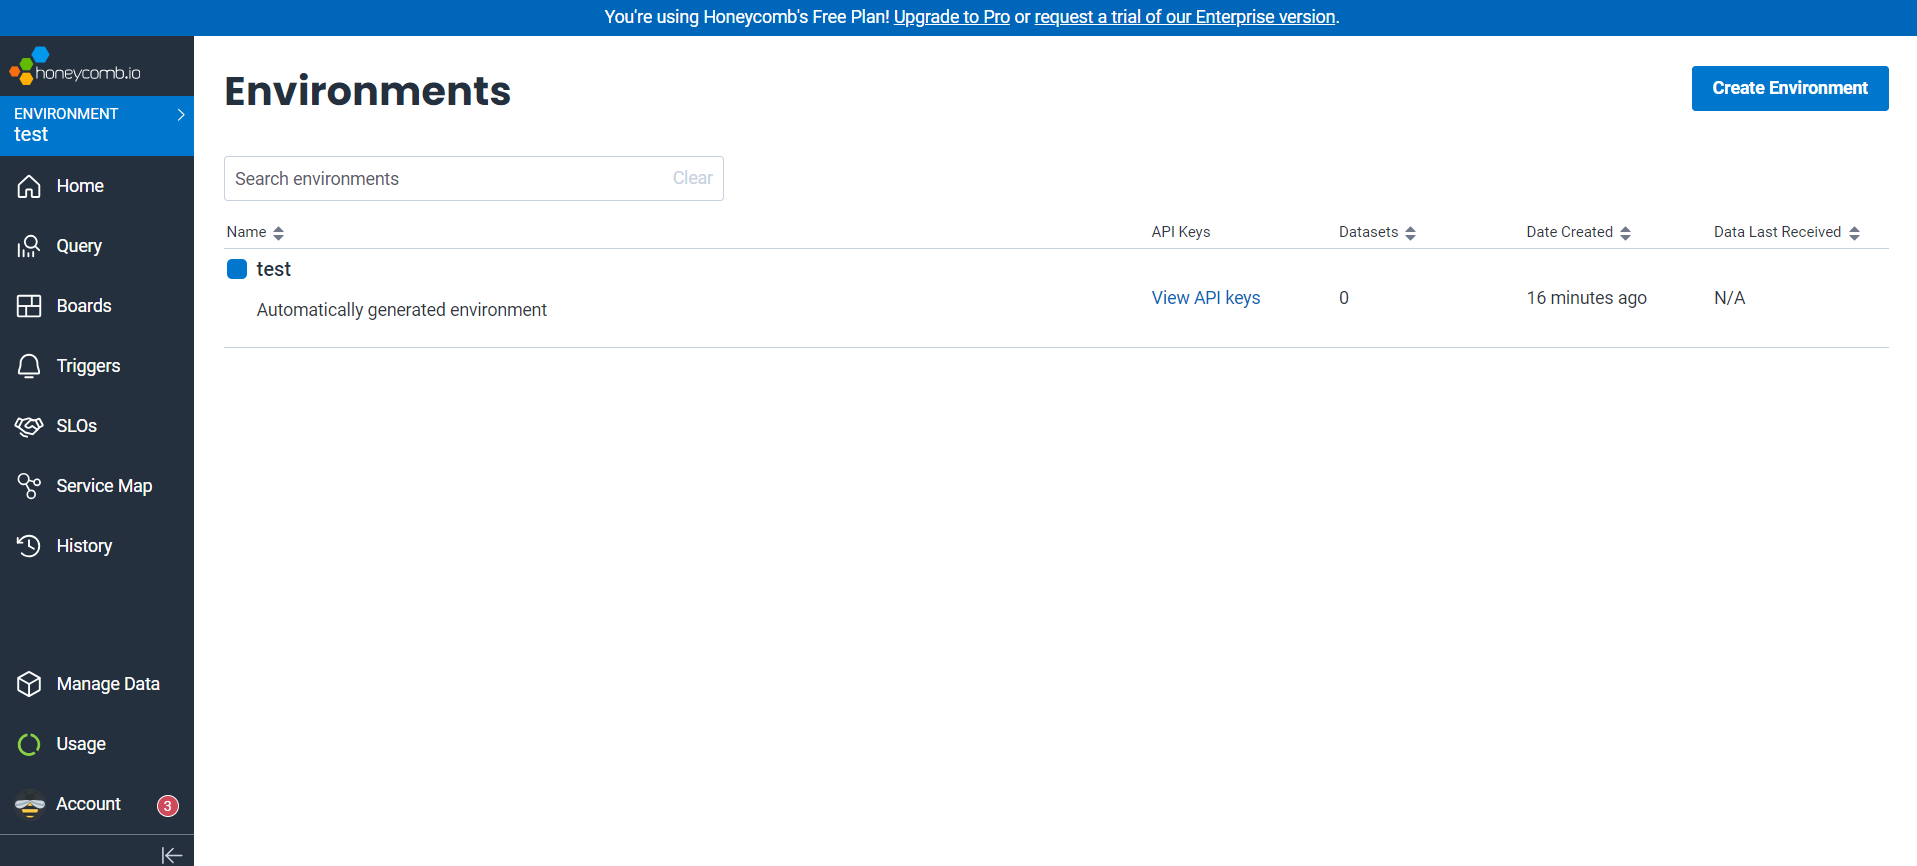
- Navigate to the Environment Section > Manage Environments page using the button in the top-left corner.
- Click Create Environment to set up a new environment. We can create a separate environment in Honeycomb for each application environment.
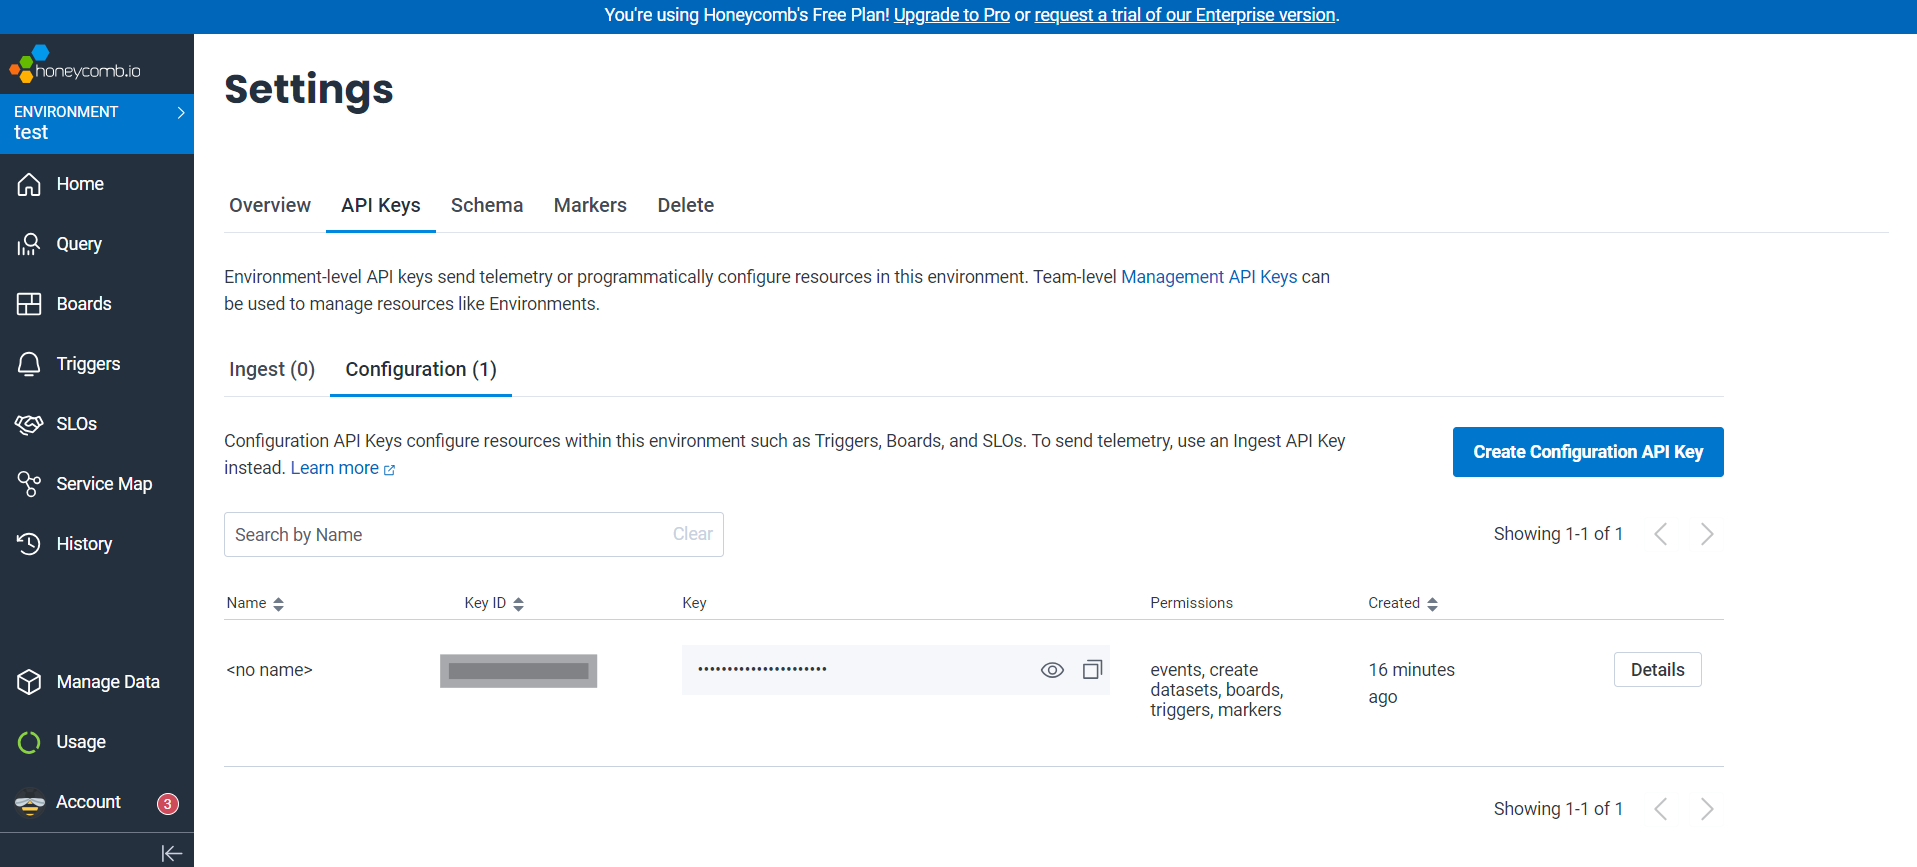
- Once created, your environment will have an API Key associated with it, available on the same page.
1.3 Retrieve API Keys for Existing Environments
If you want to use an existing environment, you can find its API Key by:
- Visiting the Manage Environments page.
- Selecting the desired environment to view its details.
By following these steps, you’ll have your Honeycomb environment ready, along with the API Key required to start generating logs.
Step 2: Integrating Honeycomb with React
Once Honeycomb is initialized, the next step is to integrate it into your React application. Here’s how you can set up error logging using an `ErrorBoundary` component and Honeycomb
2.1 Understanding the ErrorBoundary Component
The ErrorBoundary component acts as a centralized place to catch errors in your React application. It ensures that any unexpected errors are captured and logged, providing detailed information for debugging.
Here’s how you can wrap your application with the ErrorBoundary component:
// App.js or the root file of your project
import ErrorBoundary from './ErrorBoundary';

const App = ({ children }) => {
  return <ErrorBoundary>{children}</ErrorBoundary>;
};

export default App;
2.2 Libraries Needed
You’ll use the following libraries to enhance error logging:
libhoney: To send logs to Honeycomb.detect.js: To fetch user and browser configuration details.uuid: To generate unique trace Id
Install these libraries using npm, yarn or pnpm:
npm install libhoney detect.js uuid
2.3 Adding Browser Detection
Create a new file named get-browser-data.js to extract user and browser configuration details:
import detect from 'detect.js';

export const getBrowserData = () => {
  const data = detect.parse(navigator.userAgent);
  return { ...data };
};
2.4 Implementing the ErrorBoundary Component
Here’s the complete implementation of the ErrorBoundary component:
import PropTypes from 'prop-types';
import React from 'react';
import Libhoney from 'libhoney';
import { v4 as uuidv4 } from 'uuid';
import { getBrowserData } from './get-browser-data';

class ErrorBoundary extends React.Component {
  constructor(props) {
    super(props);
    this.state = { error: null, errorInfo: null };
  }

  componentDidCatch(error, errorInfo) {
    this.setState({ error, errorInfo });
  }

  render() {
    const { children } = this.props;
    const { error, errorInfo } = this.state;

    const honeycomb = new Libhoney({
      dataset: 'honeycomb-js-example', // Replace with your dataset name
      writeKey: 'YOUR_API_KEY', // Replace with your Honeycomb API Key
    });

    const browserData = getBrowserData();

    // Capture window errors
    window.onerror = (msg, url, line, col, error) => {
      const extra = col ? `column: ${col}` : '';
      const errorDetails = error ? `error: ${error}` : '';
      honeycomb.sendNow({
        Browser: browserData?.browser?.name,
        'Browser Version': browserData?.browser?.version,
        Device: browserData?.device?.type,
        Error: msg,
        'Error Extra Details': `${extra}\n${errorDetails}`,
        'Error File URL': url,
        'Error Line': line,
        OS: browserData?.os?.family,
        TraceId: uuidv4(),
        URL: typeof window !== 'undefined' ? window.location.href : '',
      });

      return true; // Suppress error alerts in the browser
    };

    // Capture unhandled promise rejections
    window.onunhandledrejection = (e) => {
      throw new Error(e.reason.stack);
    };

    if (errorInfo) {
      return (
        <div>
          <h1>Something went wrong.</h1>
          <details>
            <pre>
              {error && error.toString()}
              {errorInfo.componentStack}
            </pre>
          </details>
        </div>
      );
    }

    return children;
  }
}

ErrorBoundary.propTypes = {
  children: PropTypes.node.isRequired,
};

export default ErrorBoundary;
2.5 Key Insights for Logging
- The ErrorBoundary component is designed to catch errors and gather critical details, such as:
- Error messages and stack traces.
- Browser details (name, version) and device information.
- Operating system family and the URL where the error occurred.
- A unique TraceId for each error, generated using the uuid library, to enable easy tracking and debugging.
Datasets in Honeycomb:
Honeycomb organizes your logs into datasets, which act as logical groupings for related events. For example, you might use separate datasets for your frontend application, backend services, or other system components.
- Each dataset is defined by its name when initializing the libhoney instance (e.g., dataset: honeycomb-js-example in the code).
- This structure helps you analyze logs by specific contexts, such as filtering errors from a single source or comparing data across different services.
- You can use datasets to visualize error trends, monitor application stability, and gain insights into user interactions.
- Logs are sent to Honeycomb using the sendNow method of the libhoney object, which transmits detailed structured data. This approach ensures that each error is logged with all relevant context, making it easier to diagnose and resolve issues.
By leveraging Honeycomb datasets and structured logging, you can efficiently organize and analyze error data, ensuring a proactive approach to application stability and performance.
2.6 Extend this Setup
With this setup, you can easily log customer-related errors and other useful information to Honeycomb, helping you monitor and debug your application effectively. To do this, you’ll configure Honeycomb using libhoney—a lightweight library for sending data to Honeycomb—and use its sendNow method to capture and send logs in real-time.
Here’s how you can use it:
- Set Up Honeycomb with libhoney: Start by configuring libhoney in your application. This library makes it simple to send logs and structured data to Honeycomb.
- Create a Custom Log Structure: You can define the exact data you want to log, such as error details, user actions, or any other helpful context. This flexibility lets you tailor the logs to your app’s needs.
- Log Errors Anywhere: Use the sendNow method to log errors wherever they occur in your app. For example, on a form submission, if the form encounters an error (e.g., invalid input or server issues), you can catch the error and send a detailed log to Honeycomb for analysis.
This setup is not limited to form errors—you can apply it throughout your application to track issues, monitor performance, and gather actionable insights. By customizing your logs and using Honeycomb’s powerful tools, you can make debugging faster and improve the overall reliability of your app.
This approach is simple yet effective, making it perfect for developers, including those new to error tracking.
2.7 How to View Logs and Test Your Setup
Once you’ve integrated Honeycomb into your application, it’s essential to test whether your logging system is functioning correctly. Instead of waiting for real-time errors (which can be unpredictable and time-consuming), you can simulate an error to validate your setup. Follow these steps:
Simulate an Error for TestingTo test your error logging setup, you can use a simple example. Add a button to your application and trigger an error deliberately using the code snippet below:
onClick={() => {
  const sampleData = { name: 'UserName' };
  sampleData.map((item) => item?.name);
}}
Here’s how it works:
- Clicking the button triggers an error because .map() is called on an object (sampleData) instead of an array.
- This deliberate error will be captured by your ErrorBoundary component and logged to Honeycomb.
Steps to Test the Logging
- Run Your Application: Start your application and navigate to the page with the button you added.
- Simulate an Error: Click the button to simulate an error. Here’s where the fun begins: 🎉
- The error will show up in your browser console, letting you know the test worked.
- You can now play detective! Open the Honeycomb dashboard and see how well your setup captures the crime scene details.
- Check Honeycomb Dashboard:
- Log in to your Honeycomb account.
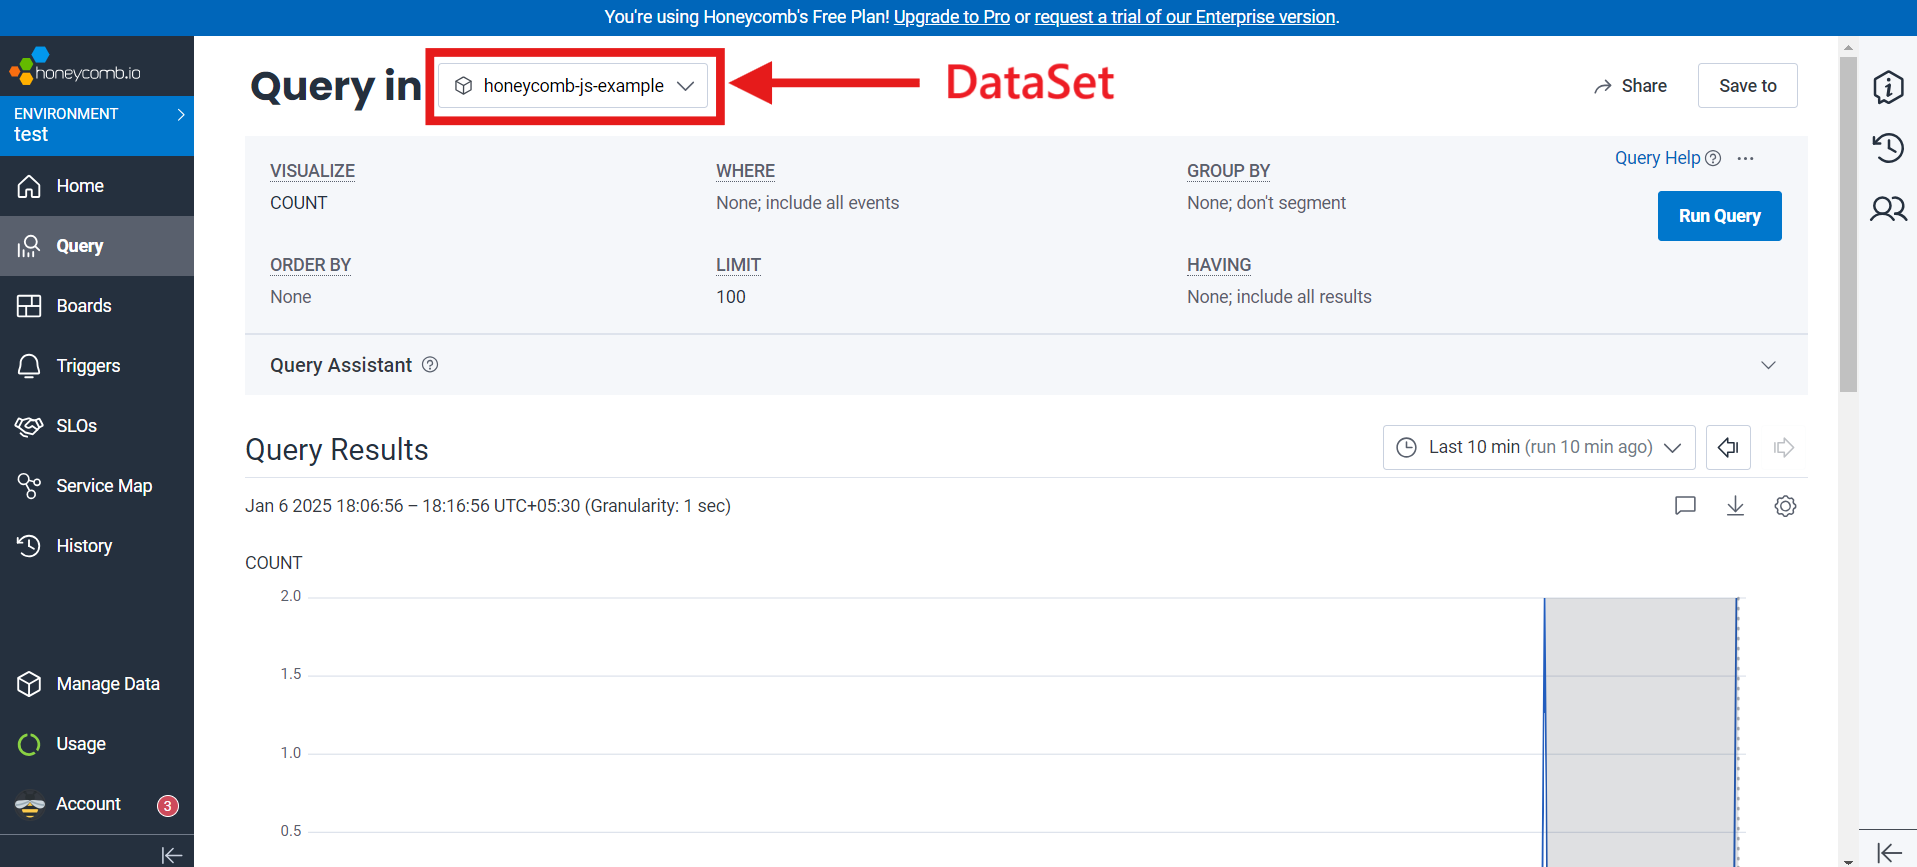
- Open the dataset you configured in the ErrorBoundary component (e.g., honeycomb-js-example).
- Click the Run Query button to fetch logs from the dataset.
- Scroll down to view the error logs, including detailed information like the error message, stack trace, browser data, TraceId, and more.
- Feel accomplished—your logs have successfully made their way to Honeycomb. You're one step closer to being an error-busting superhero! 🦸♂️🦸♀️
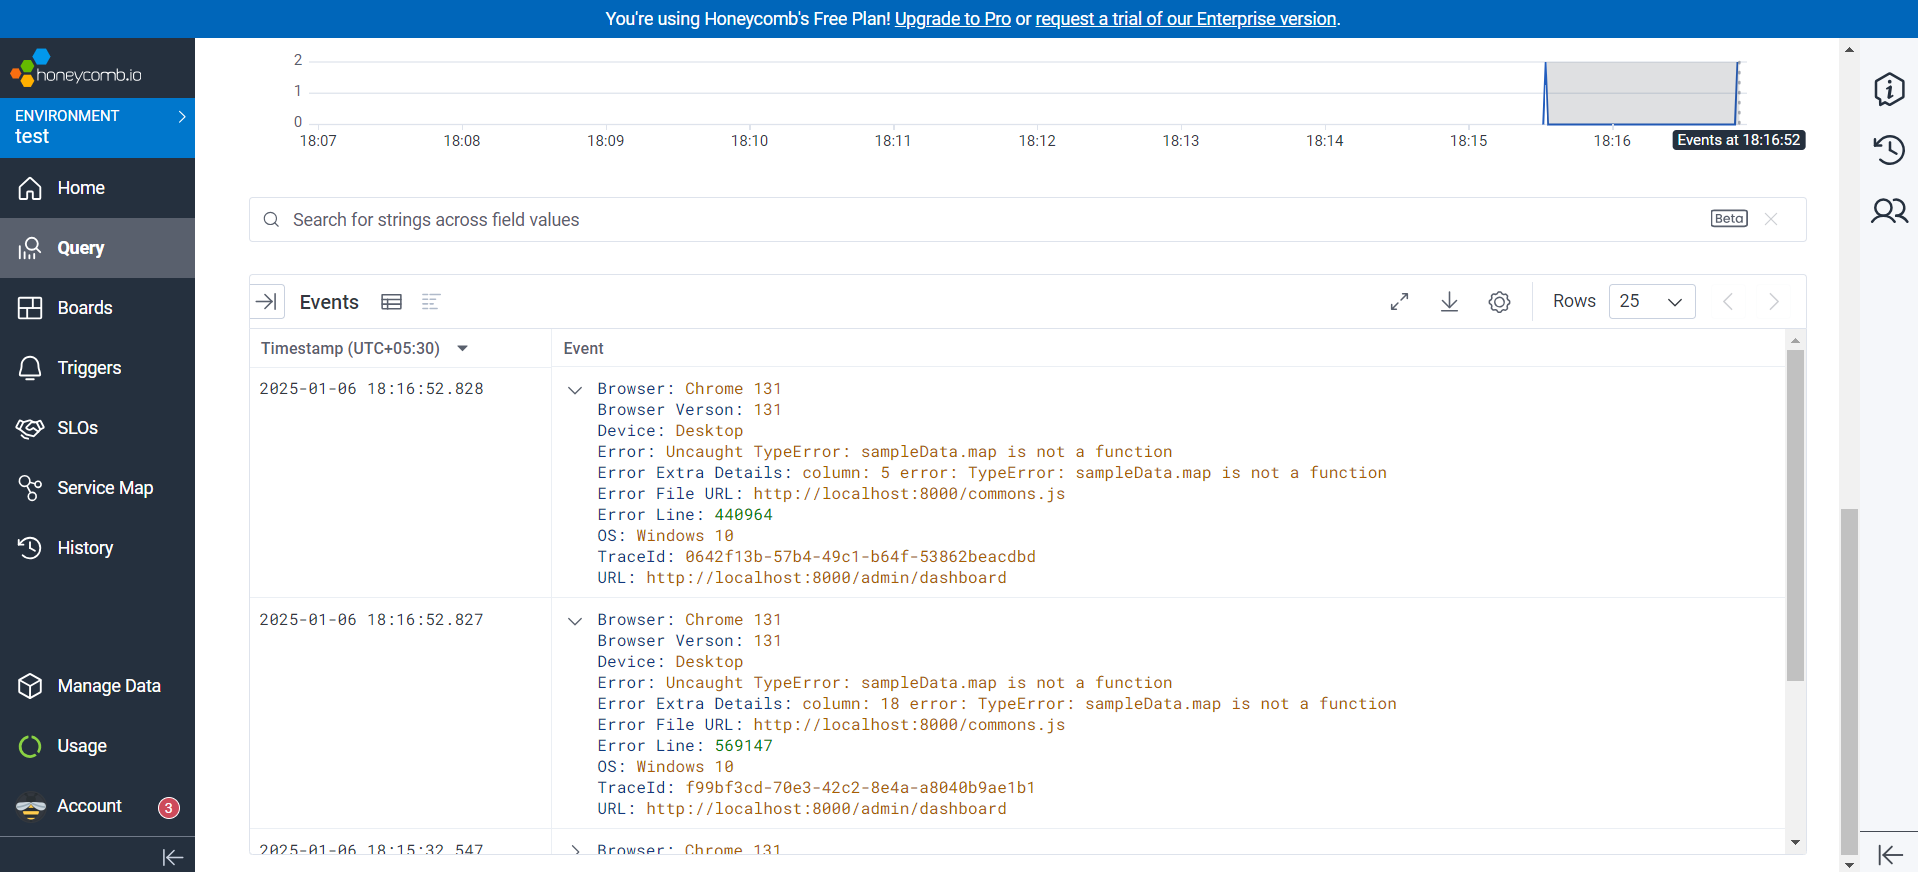
Using Filters for Detailed Analysis
Honeycomb provides powerful filtering options to help you drill down into specific logs:- TraceId: If you’ve added a TraceId in your logs, use it as a filter to isolate specific errors.
- Error Type: Filter by error message or type to find related issues.
- Browser/Device Details: Analyze errors by browser or device to identify environment-specific problems.
Analyzing Logs and Improving
The Honeycomb dashboard offers a variety of tools to analyze your logs, such as:
- Visualizations for spotting trends and patterns.
- Search and filter options for identifying recurring issues.
- Detailed views to examine individual error events.
By leveraging these features, you can gain deeper insights into your application’s behavior, enhance stability, and provide a seamless user experience.
Step 3: Setting Up Alerts
Imagine this: you're not dreaming about errors in your application, but they’re happening in real-time. Errors don’t announce their arrival—they show up uninvited, often at the worst possible time. So, how can you ensure you're promptly informed when errors occur without constantly monitoring your logs? The answer lies in Honeycomb Triggers.
Triggers are powerful tools that help you stay ahead of issues. By setting up triggers, you can receive real-time alerts when predefined conditions are met, ensuring you’re always in the loop. Here’s how to set up and make the most of Honeycomb alerts:
What Are Triggers?
Triggers are essentially pre-defined queries or filters that Honeycomb runs periodically. If the results of these queries meet or exceed a threshold you’ve set, Honeycomb will notify you via email or other configured channels. For example:
- A trigger can be set to monitor if the error count in your logs exceeds zero.
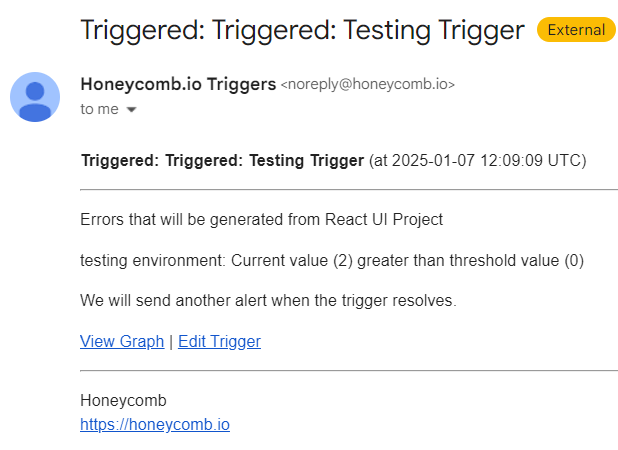
- If the threshold is met, you’ll receive a "Triggered" alert.
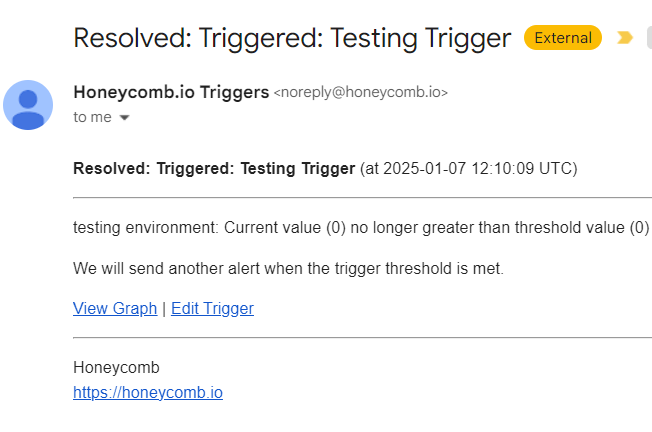
- Once the condition resolves (e.g., no errors are found), you’ll receive a "Resolved" alert.
How to Set Up Triggers
Follow these steps to set up a trigger and start receiving alerts:
Navigate to the Triggers Page
- On the Honeycomb dashboard, click on the "Triggers" menu option.
- This will open the Triggers page, where you can view and manage existing triggers or create new ones.
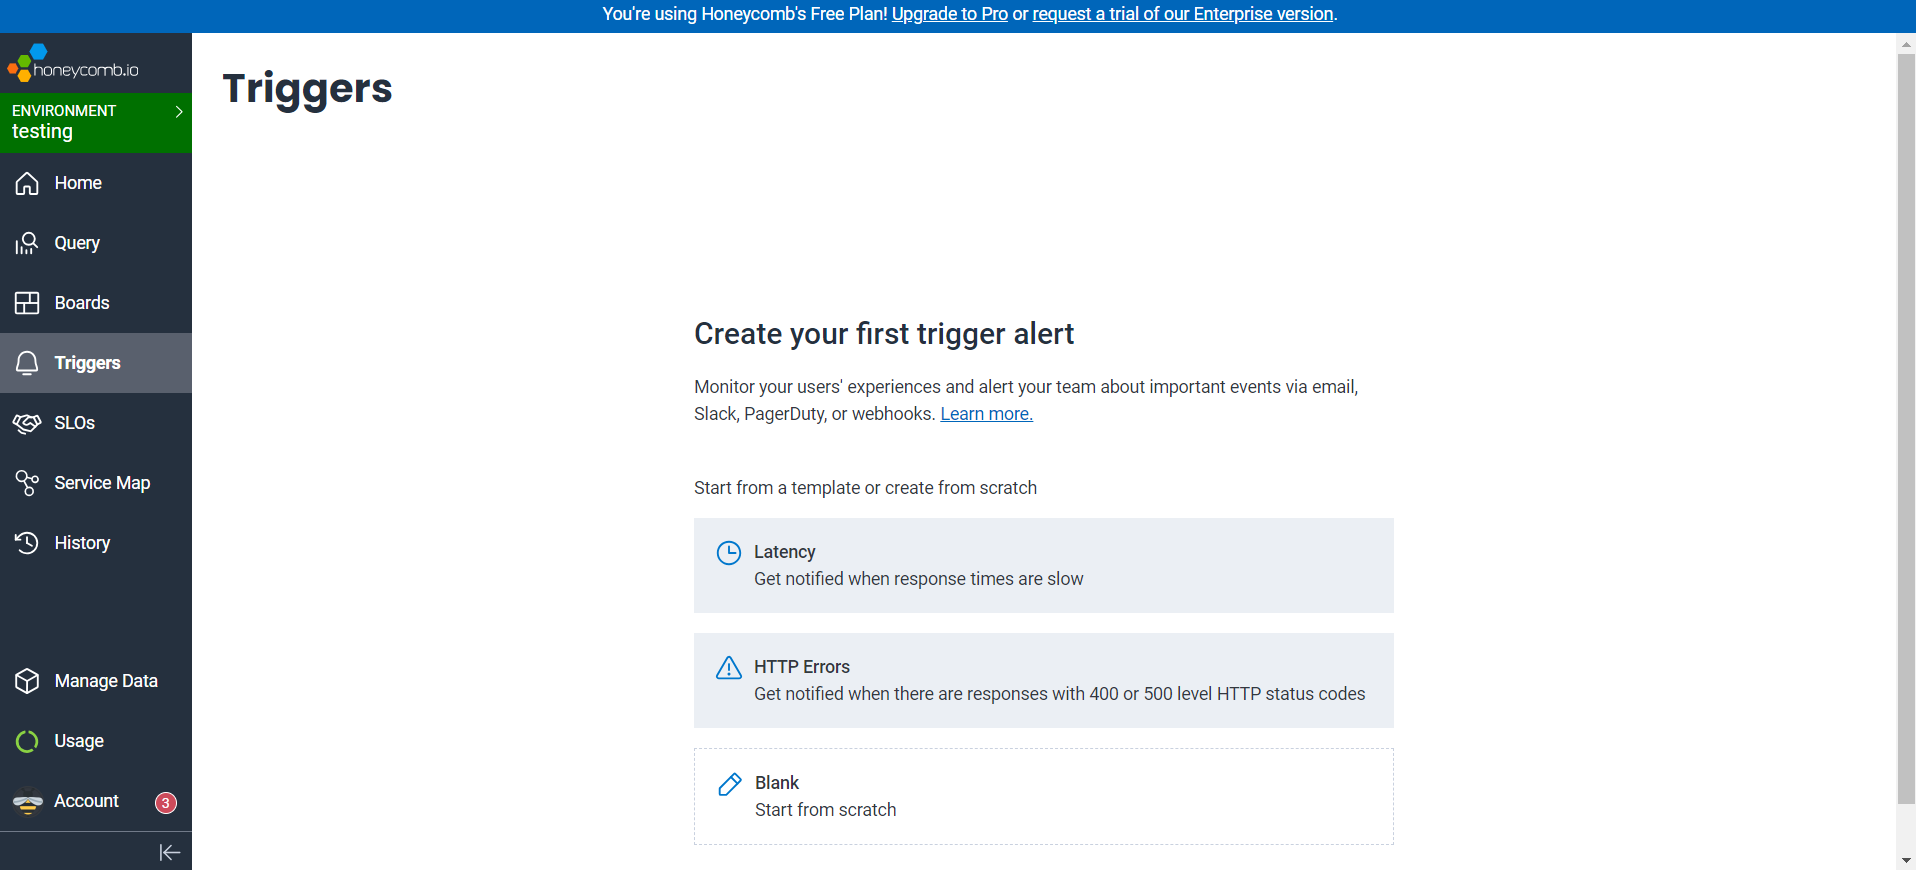
Create a New Trigger
- Click on "Blank - Start from Scratch" to define a new trigger.
- Select the dataset where you want to set up the trigger (e.g., the dataset capturing your error logs).
- Proceed to the next step, and you’ll land on the "Define New Trigger" page.
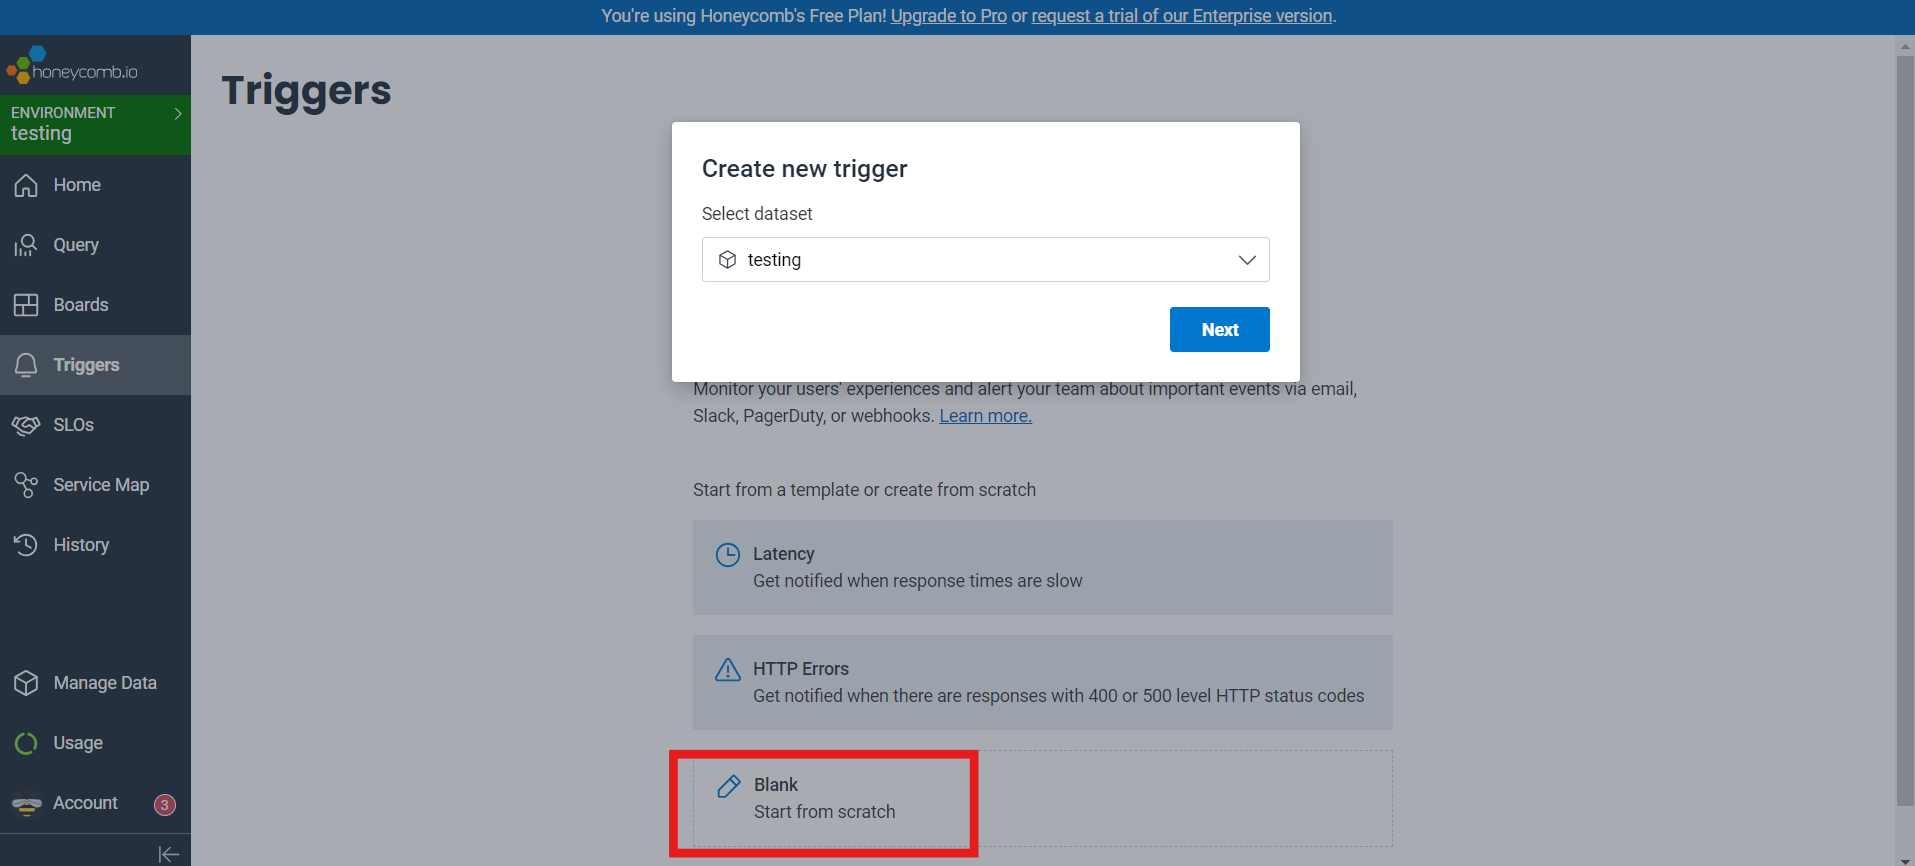
Configure Trigger Details
- Name Your Trigger: Give it a meaningful name (e.g., "Error Alert Trigger") to quickly identify it in your email notifications.
- Add a Description: Provide a brief description of what the trigger monitors. This description will also appear in the alert emails, making it easier for recipients to understand the context.
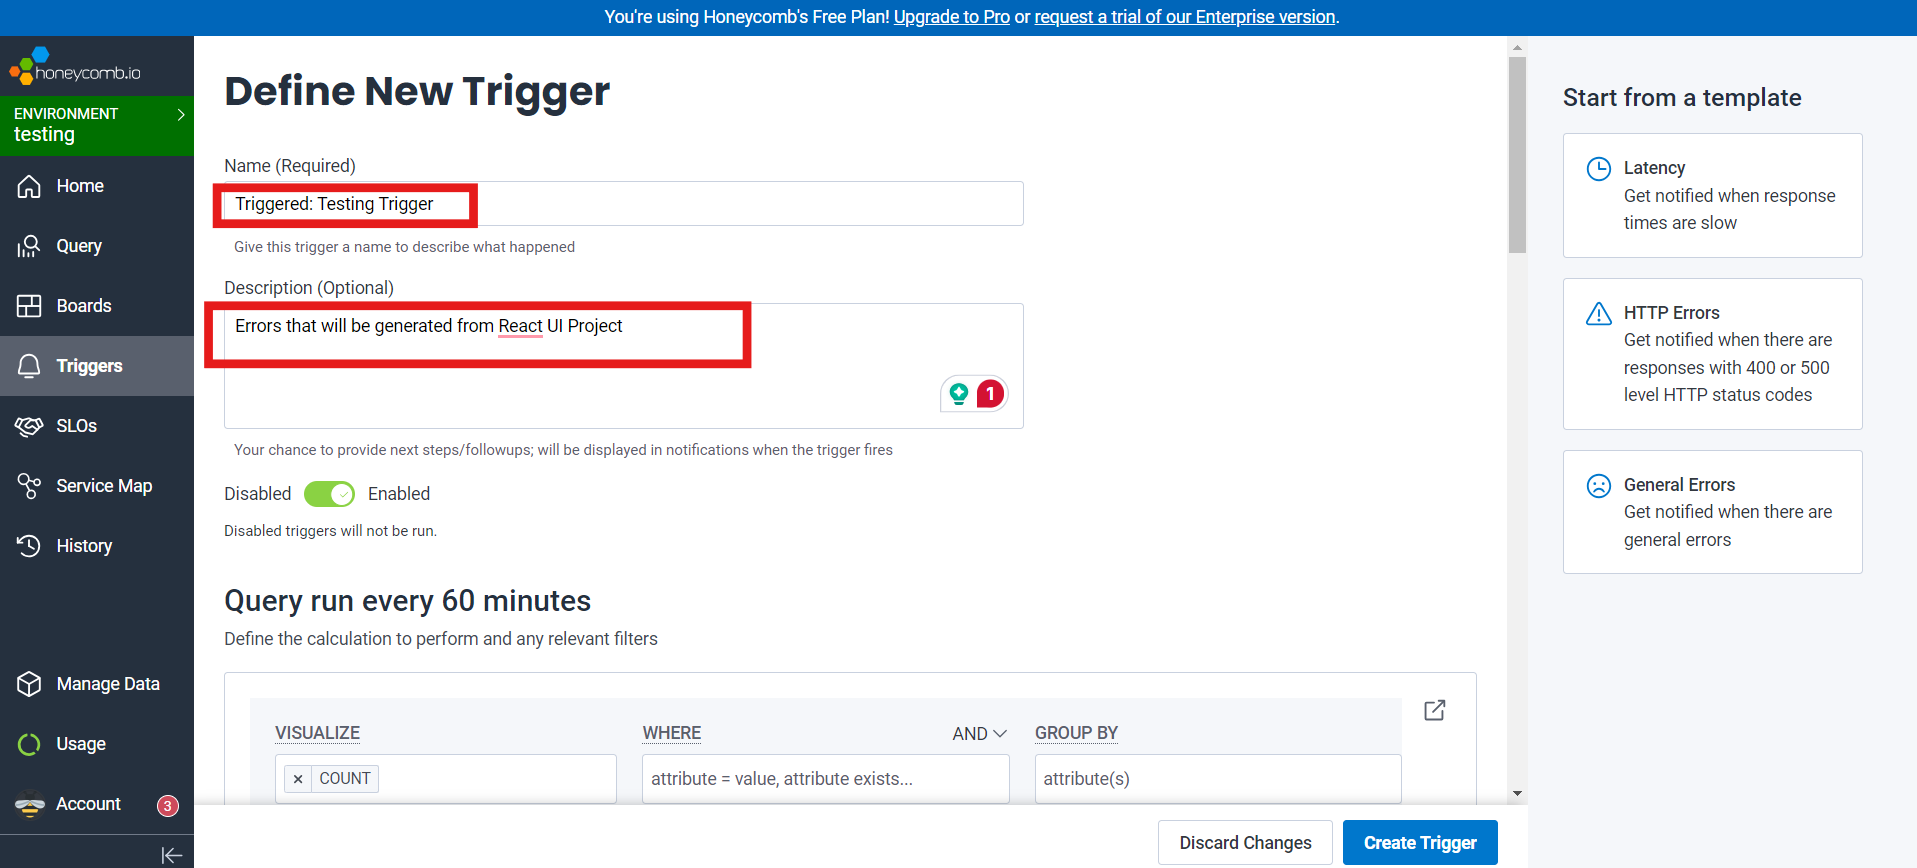
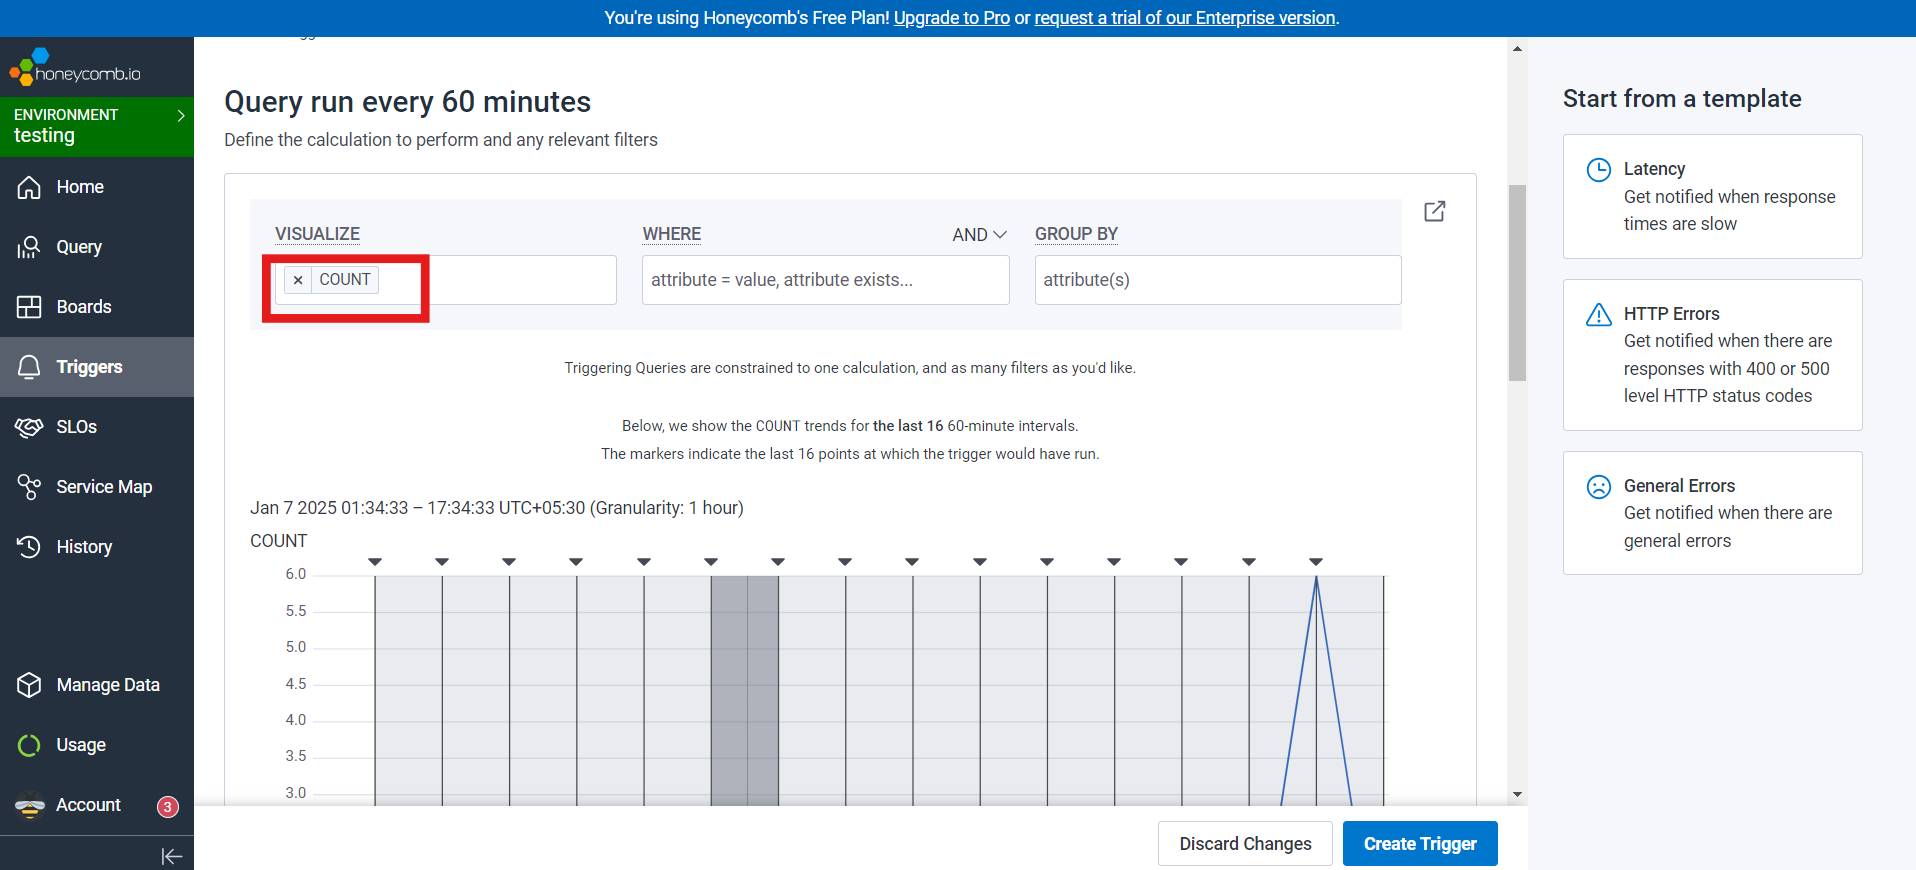
Define the Query
- In the Query Section, define the query logic that the trigger will evaluate.
- For a simple error alert, you can use COUNT to monitor the number of logs. For instance, set it to count the logs in your dataset where errors are captured.
Set Alert Conditions
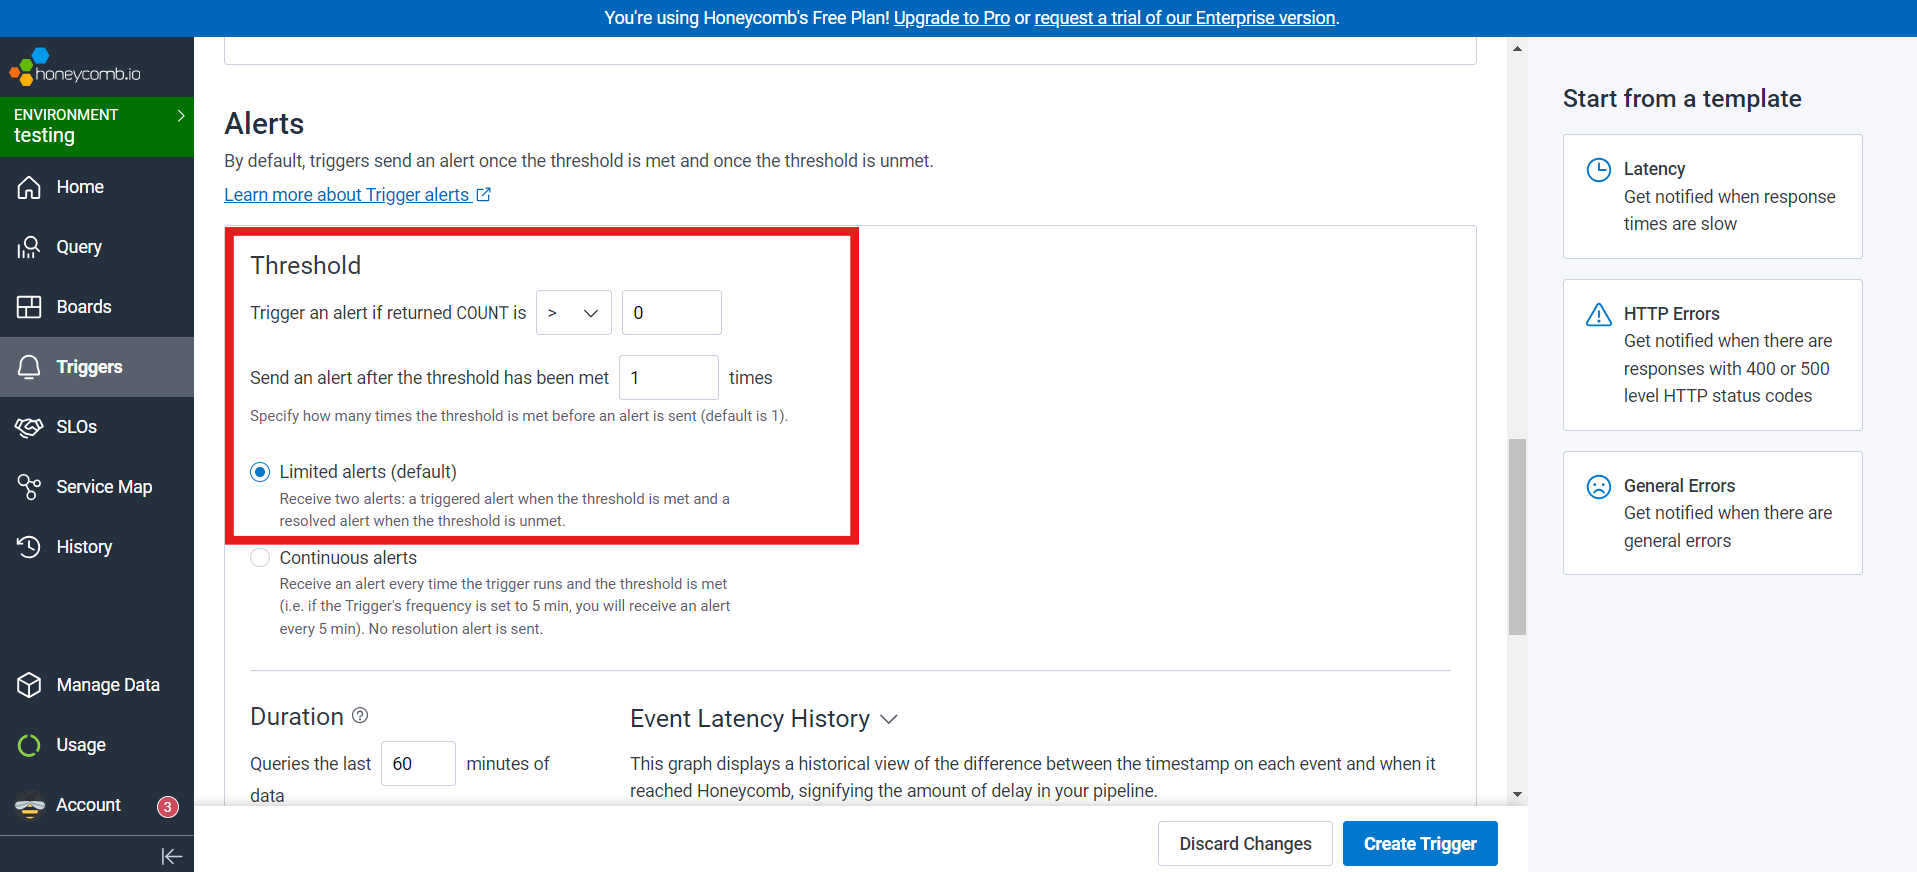
- In the Alerts Section, configure the threshold that activates the trigger.
- Example: Set the condition to trigger when the COUNT > 0 (i.e., when at least one error log exists).
- Choose "Limited Alerts (default)", which sends two alerts:
- A Triggered Alert when the condition is met.
- A Resolved Alert when the condition is no longer met.
Adjust Frequency and Duration
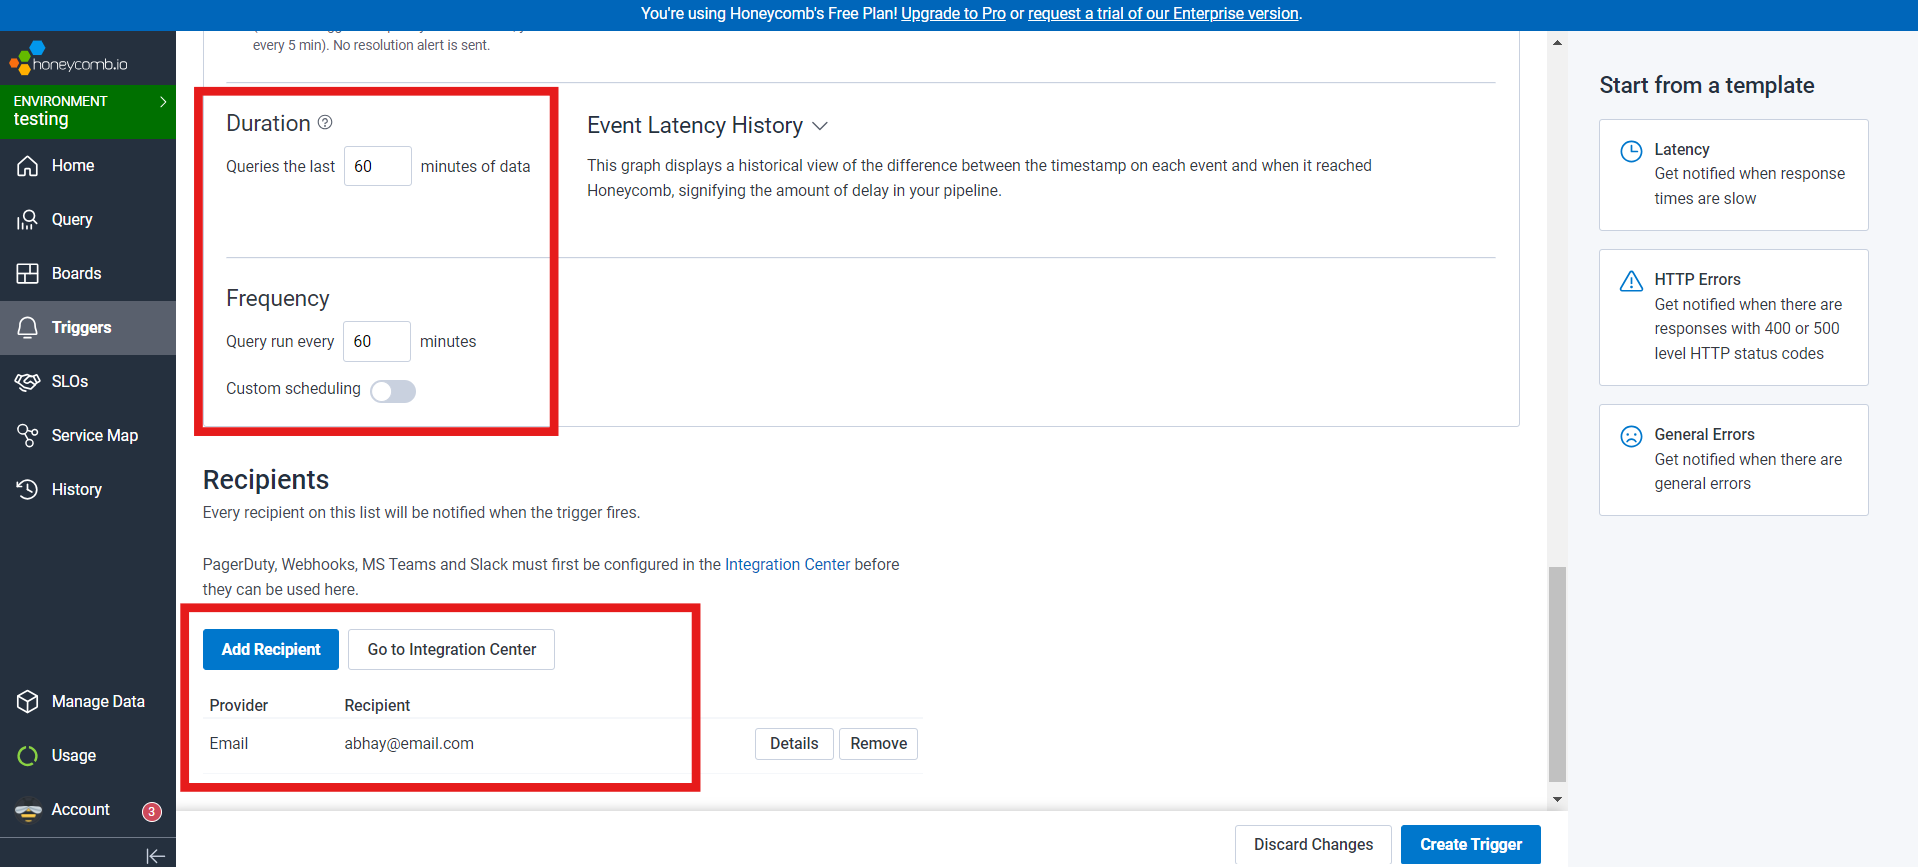
- Frequency: Define how often Honeycomb evaluates the query (e.g., every 60 minutes).
- Duration: Specify the time window for log analysis when the trigger is activated (e.g., logs from the last 60 minutes).
Add Recipients
- In the Recipients Section, specify who should receive the alerts.
- Click "Notify by Email", add the email addresses, and save the recipients. You can add multiple recipients if needed.
Finalize and Test
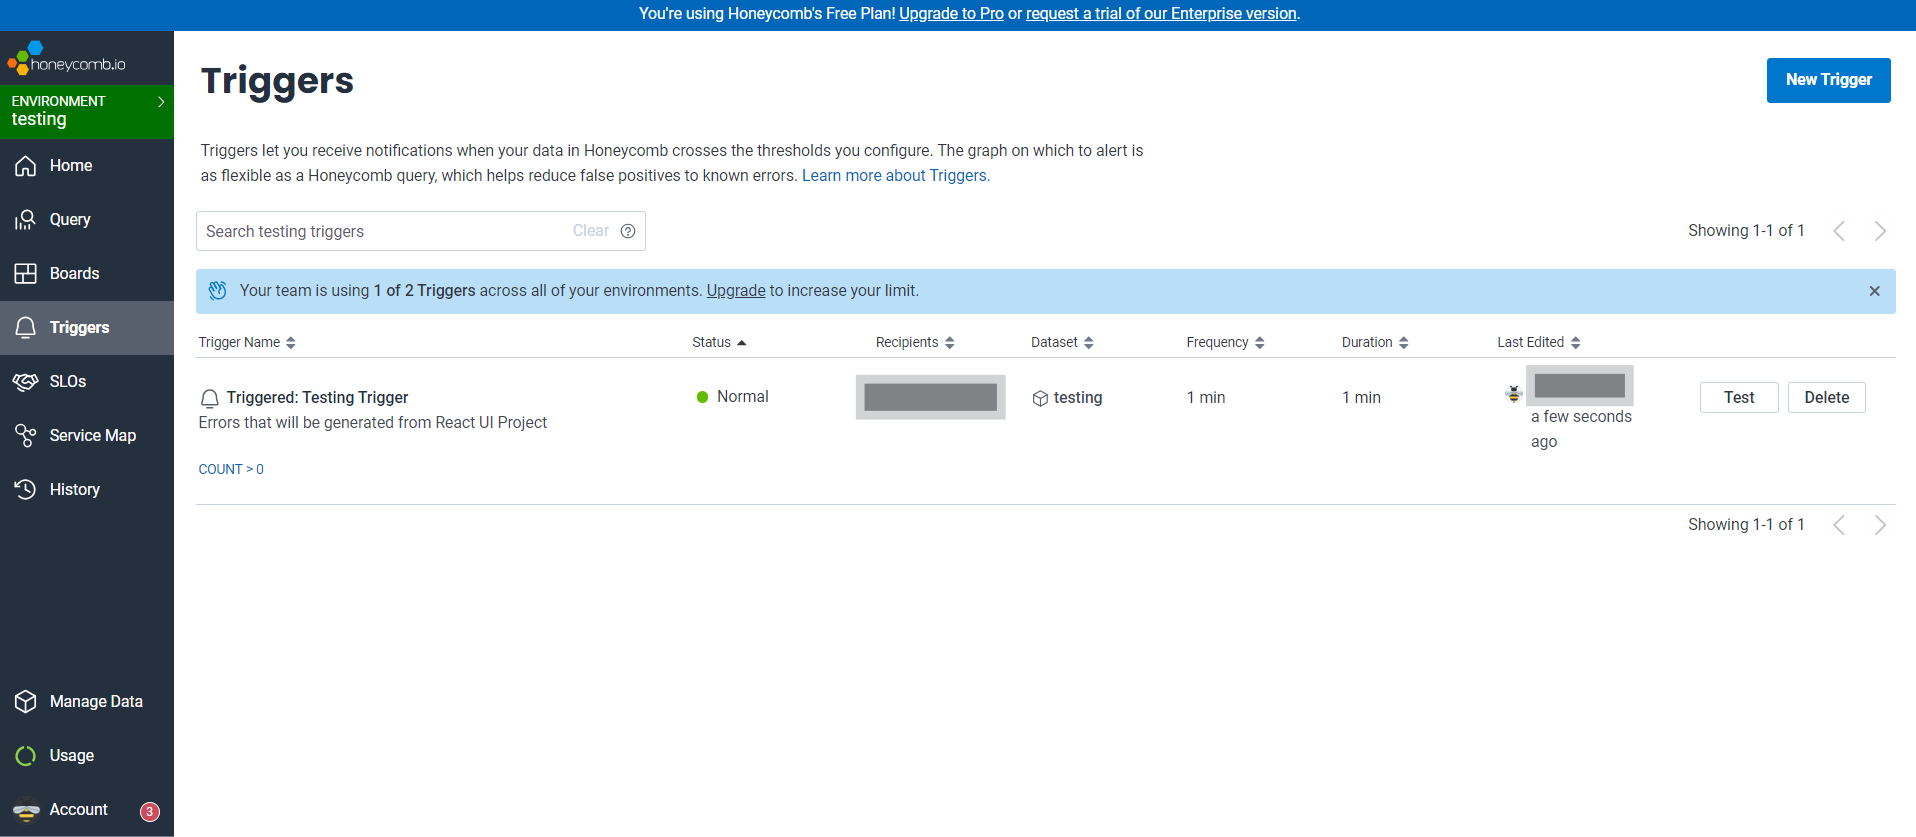
- Click "Create Trigger" to save your configuration.
- To test the trigger, generate a deliberate error in your application (e.g., using the simulated error method discussed earlier).
- Check your email to confirm receipt of the alert.
What Happens When a Trigger Activates?
- Triggered Email: You’ll receive an email notifying you that the threshold has been exceeded.
- Resolved Email: If the condition resolves (e.g., no errors are detected in the next evaluation), you’ll receive a follow-up email indicating the issue has been resolved.
Why Triggers Are Essential
- Real-Time Awareness: Get notified about issues as they occur, minimizing downtime.
- Proactive Fixes: Address errors before they impact more users.
- Streamlined Debugging: Alerts provide a clear starting point for identifying and fixing problems.
By setting up Honeycomb Triggers, you’re building a safety net for your application. These alerts ensure that you never miss an error, keeping you proactive and your application stable. So, take control of your error monitoring today and let Honeycomb do the heavy lifting! 🚀
Conclusion
In today’s fast-paced development world, where applications must be robust and reliable, having a powerful observability tool like Honeycomb in your toolkit is a game-changer. From seamless error tracking to real-time alerts, Honeycomb ensures that you’re always one step ahead of potential issues, turning logs into actionable insights.
By following the steps outlined above, you’ve equipped your application with the ability to not only detect errors but also notify you proactively, empowering you to resolve issues before they escalate. Whether you’re setting up an error boundary, integrating Honeycomb’s powerful features, or configuring triggers to stay informed, you’re now ready to enhance your application’s reliability and maintain a great user experience.
So go ahead—implement, explore, and harness the power of observability. Your users (and future self) will thank you for it! 🚀
Share Link
Interested in working with us?
Let's Connect